2020 doesn’t seem that long ago, but a lot has changed since then. The pandemic, which hit the US in March 2020, brought about a lot of societal shifts that have fundamentally changed utilities’ customer bases. For example:
- A lot of people moved to a new residence
- Many people lost jobs and found new ones, leading to fluctuating incomes
- Interruptions in income meant interruptions in payments to utilities
- An increased interest in green technology
These changes mean that the segmentation model you used to target customers in 2020 no longer accurately reflects who you should be targeting in 2023.
Comparing a 2020 and 2023 segmentation model for E-Billing provides an example.
E-Billing Segments Comparison (2020 segments vs. 2023 segments)
In 2020, BlastPoint’s analysis of one of our partner’s customer data uncovered a target segment for E-Billing. This segment had the highest likelihood of signing up for E-Billing. Here’s their data profile:
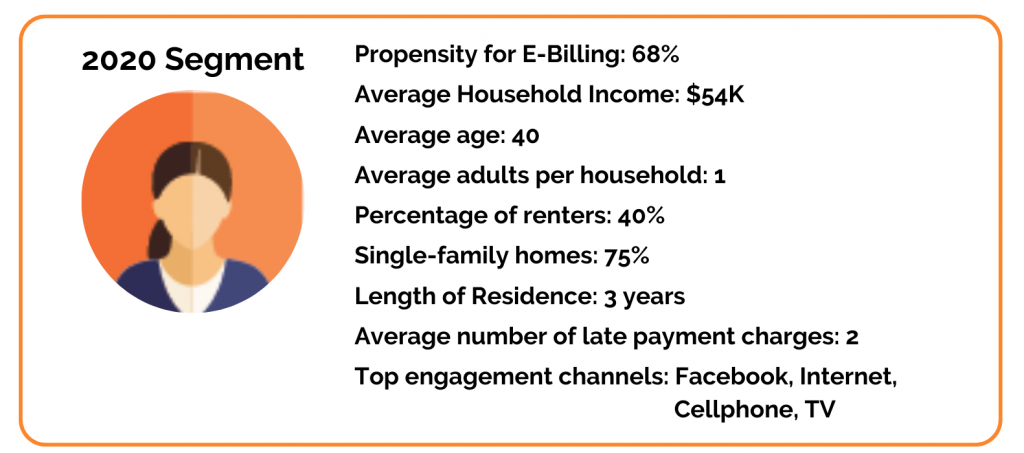
In 2023, BlastPoint re-analyzed their customer data and found that there were some shifts in the target segment’s data profile.
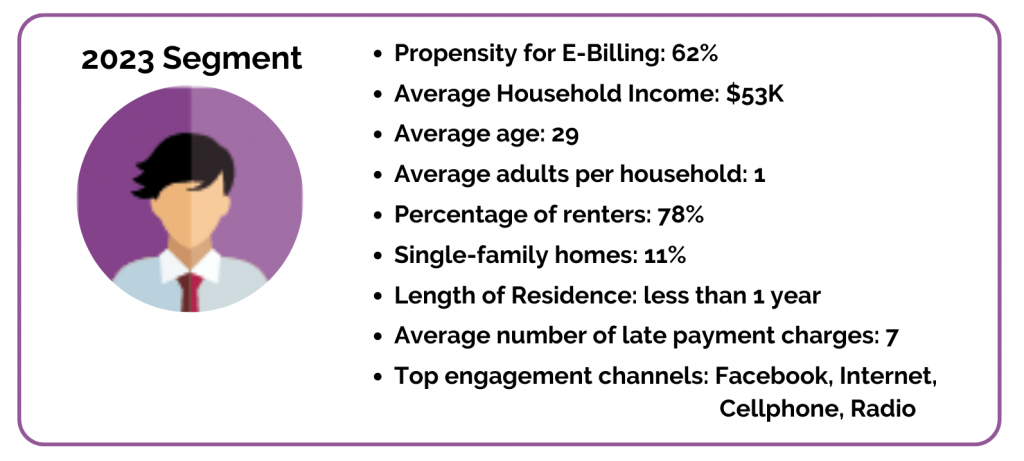
Some similarities in top targets for E-Billing in 2020 and 2023: Both have a median age younger than the customer average, they have a small household size, earn a low-to-middle income, and are the most digitally engaged customers.
Some key differences include: The average age of the top E-Billing targets decreased to 29 (an 11 year drop), a lot more of them are renters, they have a lot more late payment charges, and their channel preferences have shifted a bit – they’re more engaged with radio than they were in 2020 and less engaged with TV. They are also more transient than they were in 2020, having lived at their current address for less than 1 year on average.
A Look Back: 2020 E-Billing Campaign Results
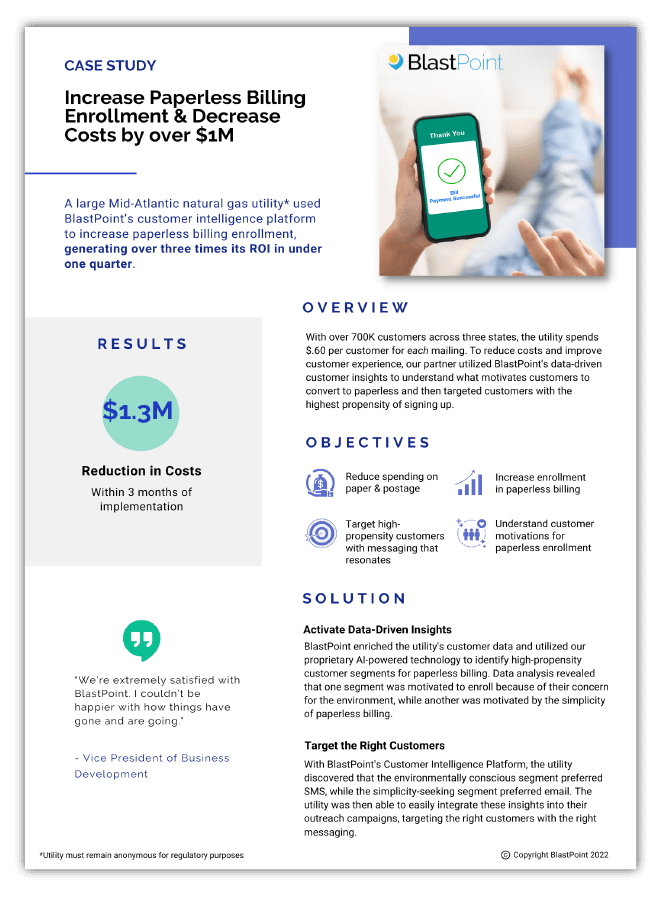
Enrolling more customers in e-billing programs can impact the utilities overall bottom line. Stamps alone can cost the utility an average of $.60 per customer for each mailing. After putting 2020 insights into action, our partner increased paperless billing enrollments by 5% saving over $1.3 million in operating expenses – all in less than 3 months from campaign implementation. Learn how they did it by downloading their case study here.
Why is it important to compare segments over time?
Our businesses operate very differently in 2023 compared to 2020. Likewise, our customers operate differently, too. By comparing data of our highest propensity segments from then versus now, we can make better business decisions that impact marketing spending or budget allocations, determine benchmarks for setting achievable goals, and reveal areas along the customer journey where teams can invest – or intervene – resources for the greatest impact.
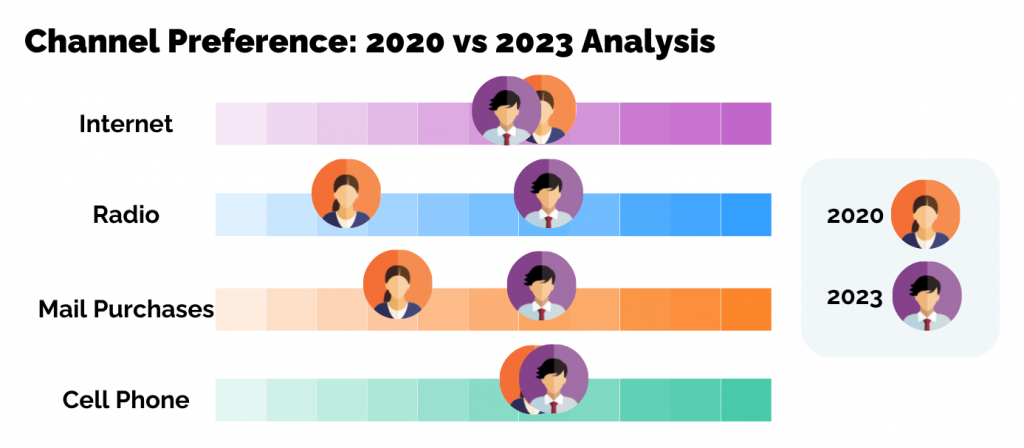
Reach Customers Where They Are
Our platform provides our partners with house-hold level insights so teams can reach customers with the right information at the right time through the right channels. In other words, we help our partners reach customers where they are.
Looking back at 2020.
Later in 2020, utilities struggled to understand their customers. For instance, unemployment was skyrocketing, and customers were struggling to pay their bills. Utilities were finding those customers weren’t taking advantage of the assistance programs and initiatives available to them.
With BlastPoint’s help, they were able to identify and engage income-eligible customers who were best-fit for customer assistance programs. These segments empowered the utility to:
- Identify customers in need and understand the reasons for their late payments,
- Reveal the most appropriate modes of communication to engage those customers, and
- Determine the right messaging to be delivered to those segments that would yield the highest engagement.
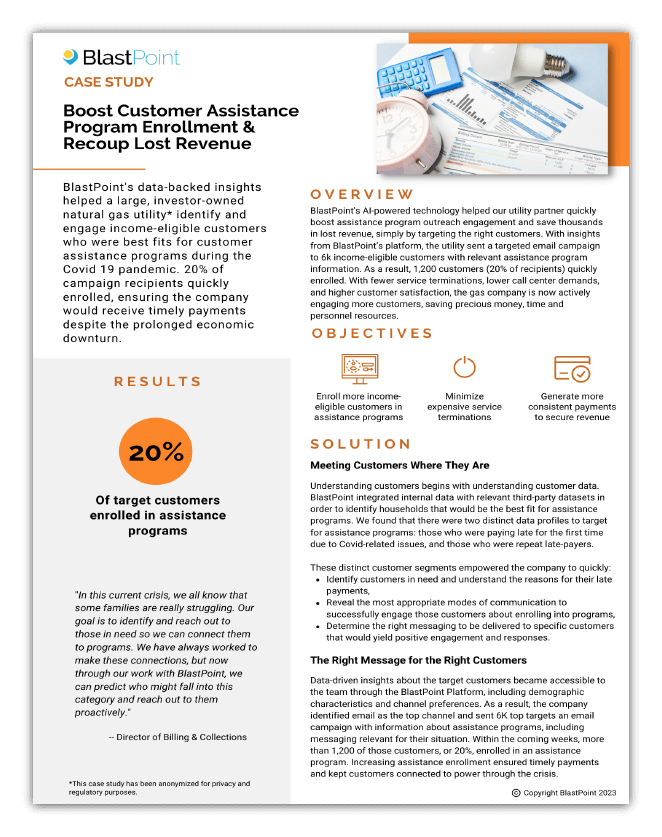
After a single, targeted email campaign, reaching customers where they are, the utility saw 20% of recipients enroll in assistance programs.
Understanding where customers are at in 2023.
Meanwhile, our 2023 segment is comprised mostly of younger renters who, on average, tend to be late-payers. To meet this segment where they are – having demographic, attitudinal, and behavioral data in hand – utilities can make data-driven decisions to reach this group with the information that resonates to help them through their journey.
For example, we additionally know this segment is digitally engaged and respond highly to social ads. Utility teams can campaign with messaging that addresses their busy lifestyles, intending to help them realize that it’s a ‘no-brainer’ to access statements online by switching to e-billing.
As time moves on, your customers’ preferences and needs evolve. This evolution encompasses the need to reach customers with the programs and initiatives they require in the present moment. By consistently updating your customer segments, your business can effectively engage with them in their current state, ensuring that customers remain engaged with your utility.
Avoid Program Saturation and Set Achievable Goals
BlastPoint’s Customer Intelligence Platform provides businesses the opportunity to compare customer segments to program saturation results.
In 2023, if our partner was to run the same email campaign as they did in 2020, targeting the same segment without refreshing the model, they likely would not have experienced the same results. Why? Because the customers within this segment who were most likely to enroll, have already enrolled. Our platform provides users the ability to see how saturated programs are against created segments.
Let’s say a business leader expects a 5% increase in 2023 e-billing enrollments. Utilizing our technology, teams can segment customers by propensity to enroll in paperless and then compare that data with those already enrolled to determine program saturation. Sometimes, we’ve found program saturation levels were high, allowing leaders to adjust expectations. Other times, teams were able to get creative in their segments, creating highly targeted campaigns not only to meet but surpass program enrollment goals.
Comparing customer data segments over time provides utilities with valuable insights beyond just determining program saturation and budgeting. Additional benefits include: evaluating program effectiveness, resource allocation optimization, demand forecasting, opportunities for customer engagement optimization, regulatory compliance and reporting, identifying emerging trends, and so much more. Learn more about this process by contacting our Solutions Experts.
Interested in modeling your customer data?
As customers and utility operations change over time, so will your customer segment data. Our patented intelligent technology segments customers easily by a range of characteristics so that you know exactly what they need, and how to reach them most effectively. Learn more by visiting our Case Studies or by checking out how Our Technology works. If you have questions or want to get started making your customer data work for you, don’t hesitate to contact our Solutions Experts at Info@BlastPoint.com. We look forward to hearing from you soon.
Learn how our partner increased paperless billing enrollment and generated over three times its ROI in under a quarter by reaching target customers through the right channel at the right time by downloading their case study.

