

The Sustainability Benchmarks Report compares utilities’ progress in six key sustainability areas: demand response, dynamic pricing, energy efficiency, renewables, AMI rollout, and overall reliability. It lists the top 10 companies for each of these areas within investor-owned (IOUs), municipal (munis), and cooperative (coops) ownership categories. Additionally, the report provides case studies for utilizing customer intelligence to boost engagement with sustainability programs, which recent findings have correlated with higher customer satisfaction scores (CSAT).
Customer Awareness of Sustainability = Higher CSAT Scores
When it comes to customer experience and satisfaction scores for utilities, sustainability is very significant. Specifically, low consumer awareness of sustainability programs means lower overall customer satisfaction for utilities. According to the 2021 JD Power Sustainability Index, there is “persistently low consumer awareness for utility climate initiatives,” with only 23% of electric utility customers showing awareness of company efforts to lower greenhouse gas emissions and less than 50% believing that their utility will reach 100% clean energy by 2050.
Similarly, the American Consumer Satisfaction Index (ACSI) Energy Utilities Report 2020-2021 showed that consumer scores for a utility’s “efforts to support green programs that impact the environment” and “information provided on energy-saving ideas” consistently brought down ratings for investor-owned utilities, municipal utilities, and cooperatives.
The good news, however, is that some utilities were able to increase their sustainability awareness in 2021 and improve customer experience as a result. BlastPoint’s partner Duquesne Light Co., for example, boosted their sustainability score by 3 points last year, placing them among just a handful of electric utilities that raised their score.
Cue the Sustainability Benchmarks Report. BlastPoint’s work with utility partners over the last year has shown us that when utilities understand customers better through data-driven insights and then operationalize those insights, they enroll more customers in relevant programs and boost customer satisfaction. For utility teams, an awareness of where their company stands in comparison to these six sustainability benchmarks can provide the context needed to grow sustainability programs strategically.
Findings: AMI is surging, Renewable Energy is struggling
AMI
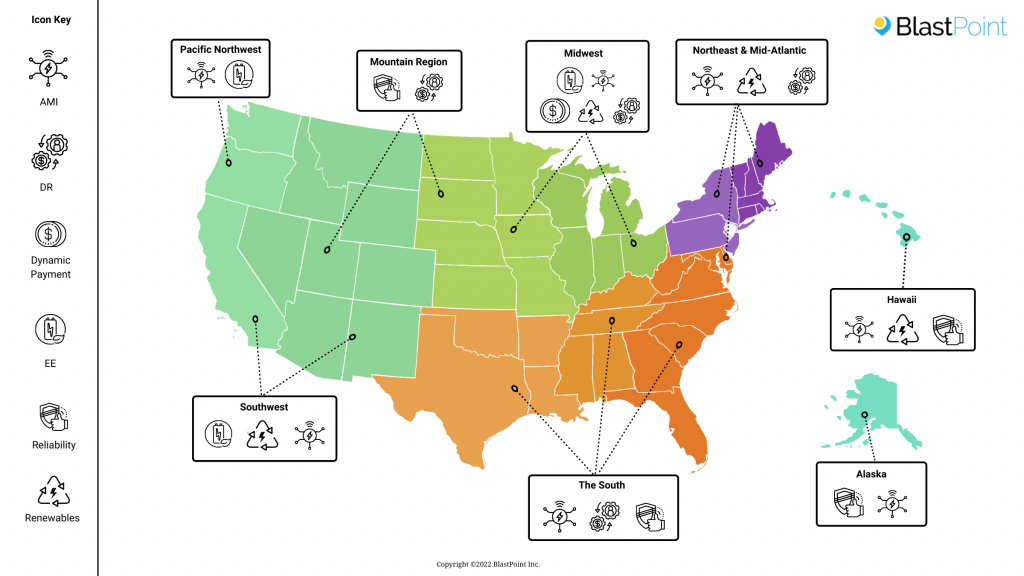
On a high level, the data shows that US utilities have made the most sustainability progress with Advanced Metering Infrastructure (AMI). Also known as “smart meters,” AMI is foundational to promoting sustainable energy use among residential, commercial, and industrial customers. Across all three ownership categories, we see numerous utilities at 100% AMI installation. Coops are the most advanced, with 300+ companies at 100%. These companies are located in every major region of the US (see map below). The overall AMI installation percentage is 88.5% for industrial, 80.5% for residential, and 78.6% for commercial.
Demand Response & Dynamic Pricing
Demand Response (DR) is also taking off across the US, including in the South and Mountain Region, which is otherwise not a standout area for sustainability programs. Munis and Coops have a higher percentage of their residential customers enrolled in DR programs than do IOUs. Conversely, more IOUs have been successful at enrolling customers in dynamic pricing, particularly industrial customers.
Energy Efficiency
IOUs are the leaders in energy efficiency, as well, and the highest impact of EE programs (in terms of energy saved per customer) is for industrial customers, by far. Otter Tail Electric Co., an IOU operating in Michigan, appears near the top of the residential, commercial, and industrial lists, saving a whopping 28,278.2 mwh per industrial customer in 2020. We see more EE top 10 companies on the West Coast, the Midwest, and the Northeast, although there are some outliers. Four County Electric, operating in North Carolina, tops the residential top 10 list for coops, and Austin Energy is near the top of the industrial list for munis.
Renewable Energy
Renewable energy is the category with the lowest scores across the board. Not surprisingly, utilities in Hawaii and the Southwest dominate the top 10 lists for renewables. Recently combined under the umbrella of Hawaiian Electric Industries, IOUs Maui Electric Co., Hawaiian Electric Co., and Hawaii Electric Light Co. rank highly for commercial and industrial customers. Southern California companies San Diego Gas & Electric and Southern California Edison, as well as Arizona companies Arizona Public Service and Tucson Electric Co., also lead in the IOU category.
In the IOU and Coop categories, there are also several northeastern companies on the top 10 lists, including Atlantic City Electric Co., with 7.4% of residential customers using renewables and 6.6% of industrial. Within the Coop category, we do see more geographic diversity, with southern companies like Ozarks Electric Coop (Arkansas) and Tri-County Electric Coop (Oklahoma) and midwestern companies including MiEnergy Coop (Iowa) and Magnolia Electric Power (Missouri) making the lists.
Renewables can be considered a growth area for most utilities; however, with the price of renewable energy certificates going up, utilities may need to reconsider target customers.
Reliability
Just as AMI is a foundation for sustainability program growth, reliability can be a product of that growth. Customers’ outage experiences are often a determining factor for their CSAT scoring. At the same time, enrolling more customers in energy-saving programs can support a stronger grid with fewer power disruptions.
BlastPoint used Low Customer Average Interruption Duration Index (CAIDI) scores to rank utility reliability, as these scores provide the average outage duration that any given customer would experience and are therefore a widely used indicator of reliability. We include the companies with the lowest CAIDI scores both with and without major event days (MED) to normalize utility reliability performance outside of major events. We found that municipal utilities on the top 10 list have the lowest CAIDI scores of all, making them the most reliable of US utilities. The Village of Muscoda (WI), the City of Taunton (MA), and the City of Burbank Water and Power (CA) are at the top of the list.
On the Coop list, Jefferson Davis Electric Coop (LA), Clay County Electric Coop (MO), and Sioux Valley SW Electric Coop (SD) are prominent and also showcase a trend of lower CAIDI scores in the South, Mountain Region, Alaska & Hawaii, and, to a slightly lesser degree, the Midwest. Companies on the West Coast and in the Northeast show, generally, less reliability, although Fitchburg Gas & Electric (MA) is an exception when we look at CAIDI scores without MED.
Customer Intelligence Helps Utilities Boost Sustainability Engagement
The bottom line is that when utilities grow sustainability programs, they establish good faith with customers, support better reliability, and raise their sustainability profile – all of which raise CSAT scores. Increasing the visibility of sustainability programs is easier with customer intelligence. BlastPoint has helped our utility partners grow their programs by up to 20%, on average. Visit our Sustainability Solutions page to learn more about our offerings, and download the complete 2022 Sustainability Benchmarks Report.