U.S. utilities requested nearly $31 billion in rate increases in 2025, the highest total since rate case tracking began in the early 1980s. At the same time, 1 in 6 U.S. households are now behind on their energy bills. Regulators are taking longer to close cases. Intervenors are more organized. Commissions are asking harder questions about affordability before approving anything.
Most utilities walking into this environment are measuring their exposure the wrong way.
The working assumption in most regulatory filings is that affordability pressure tracks with rate levels. High rates mean high pressure. Keep rates low and a utility is defensible. That framing shapes rate case strategy, customer program design, and capital planning at utilities across the country.
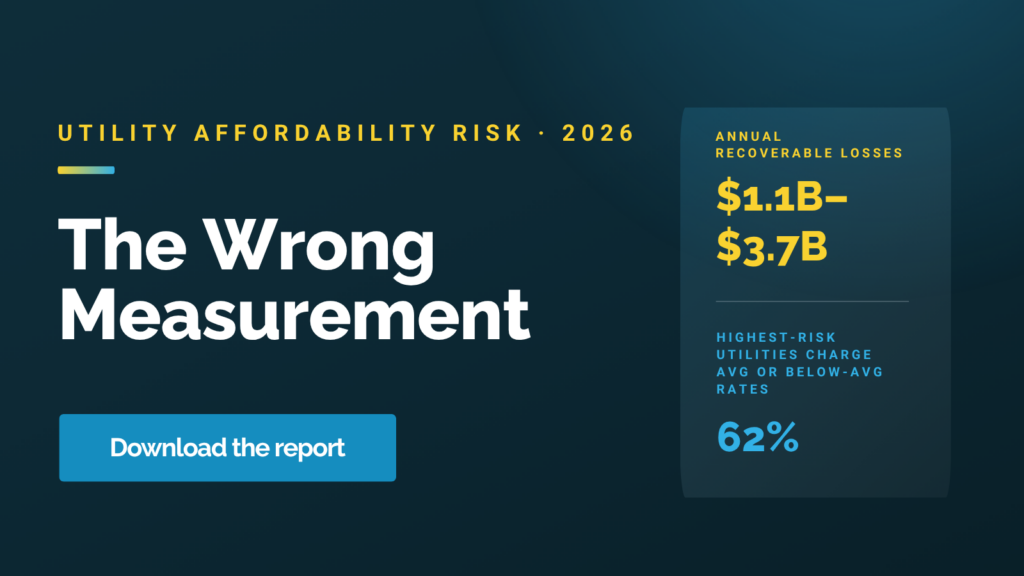
Here is what the data across 602 electric and 186 gas utilities actually shows: 62% of the utilities with the highest affordability pressure charge at or below the national average residential rate. Their risk is not coming from what they charge. It is coming from who they serve: communities where a significant share of households already spend 6 to 10% of their income on energy before any increase lands.
That is five times the share higher-income households pay. Any rate increase, even a modest one, hits those households with no room to absorb it.
When you run the right measurement across the full dataset, the risk map looks nearly the inverse of what rate levels suggest. Some of the most defensible utilities in the country charge above-average rates. Some of the most exposed charge below average. And here is the part most leadership teams do not expect: utilities ranked Defensible in their cohort are not off the hook. The losses accumulate there too. Slower, without a rate case forcing anyone to surface them, but they accumulate.
The cost shows up as bad debt on the P&L, call center volume that should not be that high, and campaigns that reach the wrong households. Across the utilities we could measure using public EIA data, the recoverable total runs into the billions annually.
The new report, The Wrong Measurement: Why the Utility Industry Is Misreading Affordability Risk, covers what the correct measurement is, how it changes the risk picture, what it costs in dollars when utilities get it wrong, and what a handful of utilities are doing differently to close the gap.
It is written for executives and teams in regulatory affairs, customer strategy, and financial planning at U.S. utilities.
Click the button below to download the report.
PressurePoint by BlastPoint scores 602 U.S. electric utilities and 186 gas utilities on structural affordability exposure using EIA Form 861/176 rate data and U.S. Census Bureau ACS household-level microdata. Full methodology: pressurepoint.blastpoint.com/methodology