Summary: BlastPoint’s new Banking Scorecard scores every active FDIC-insured bank on operational performance – giving banks a new competitive benchmark to find opportunities for structural growth.
For years, sophisticated bank benchmarking remained buried within data sets too raw and fragmented for practical industry-wide decision-making without expensive terminals or consultants. That model no longer fits a modern banking environment, where informational advantages should no longer be limited by an institution’s scale. At the same time, the industry is entering a period in which broad access to comparative performance intelligence is becoming essential for banks of all sizes to remain competitive amid growing market pressures.
That is why BlastPoint is looking to close the data gap with their Banking Scorecard – a free platform that makes peer-cohort performance data publicly available for every FDIC-insured bank in the United States.
What is the BlastPoint Banking Scorecard?
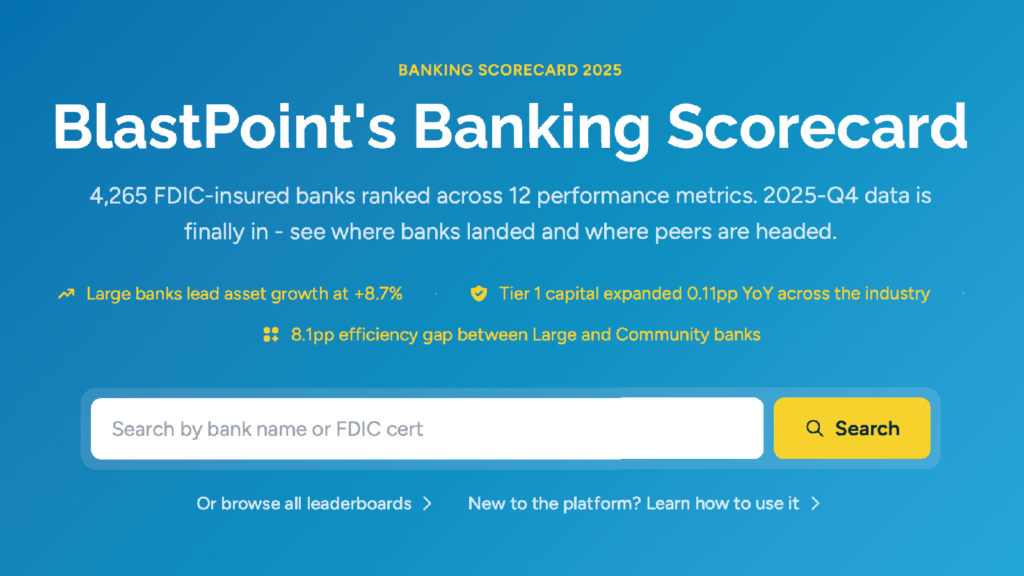
The BlastPoint Banking Scorecard is a public benchmarking platform covering every active FDIC-insured bank in the United States. It ranks institutions across 12 core financial metrics within multiple peer cohorts, including nationally, by state, and by asset cohort.
It includes:
- Percentile rankings across key financial indicators for each bank
- Behavioral signatures that identify distinct operating conditions at a glance
- Straightforward performance summaries of where they stand relative to comparable institutions
The platform covers the full U.S. banking landscape – from $100 million banks to monolithic organizations like JPMorgan Chase – and tracks eight quarters of FDIC call report data, refreshed automatically each quarter. Unlike most regulatory datasets, the Scorecard was built to focus on relative performance and interpretability while making competitive positioning legible.
Why is the Banking Scorecard relevant now?
Over the last year, $25B-$250B and $500M-$5B banks have developed significant gaps in performance in ways that raw growth numbers alone don’t capture. In 2025:
- The operational divide between $25B-$250B banks and $500M-$5B banks is wide and persistent.
- Banks with $25B-$250B in assets posted asset growth of +8.7%, while banks with $500M-$5B grew at +7.1%
- The efficiency ratio gap between $25B-$250B banks and $500M-$5B banks now stands at 8.1 percentage points
- 441 banks sit in the bottom quartile of Tier 1 capital within their peer group, 371 of them $500M-$5B banks
While these numbers don’t signal a crisis, they do indicate smaller institutions are operating at a structural efficiency disadvantage relative to larger banks – a challenge that is difficult to close without scale. At the same time, credit-quality pressure is appearing more frequently across the industry, with loan delinquency rising year-over-year at 958 banks. These gaps are not self-correcting, however, without clear peer comparisons, it’s difficult to tell whether the problems are cyclical or a sign of structural weakness.
What makes the Banking Scorecard different?
The Banking Scorecard does not replace raw data sources; it builds on top of them. For example, the FDIC BankFind API already publishes the underlying call report data. However, these reports alone do not provide actionable context.
For instance, a financial strength at one institution may be a relative weakness at another depending on factors like:
- Asset mix
- Risk exposure
- Market concentration
- Peer-group norms
- Competitive geography
To address this challenge of extracting the story out of the data, BlastPoint’s Scorecard layers interpretation through:
- Peer-relative rankings, not only raw values
- Multiple overlapping comparison cohorts
- Both quarter-over-quarter and year-over-year trend visibility
- Named pattern detection that surfaces conditions the raw data doesn’t make legible
- Straightforward bank pages readable suited for readability and fast interpretation
How does the Banking Scorecard calculate performance?
The Banking Scorecard recognizes that operational efficiency means something very different at a $2 billion bank than at a $50 billion bank. As a result, the Scorecard computes percentiles within peer cohorts so that every comparison is truly apples-to-apples.
To achieve this structure, the Scorecard analyzes data through four steps:
- Data Ingestion: Quarterly call report data is pulled directly from the FDIC BankFind API, covering every active FDIC-insured institution.
- Cohort Assignment: Each bank is assigned to overlapping comparison groups based on asset size, geographic market, FDIC specialization category, and state-level competitive landscape.
- Percentile Ranking: Banks are ranked across 12 financial metrics within each cohort.
- Signature Detection: The system evaluates each institution against a library of behavioral patterns or “signatures” designed to identify recognizable financial operating conditions.
Additionally, the classification framework includes several refinement layers:
- The 12 tracked metrics span size, profitability, efficiency, liquidity, credit quality, and revenue mix – covering measures such as return on assets, net interest margin, and non-performing asset ratios.
- The scoring model is polarity-aware, meaning metrics where lower values indicate stronger performance are ranked appropriately.
- Asset cohorts span the full distribution, from $500 million in assets to more than $250 billion.
- Banks with less than $500 million in assets are ranked but excluded from behavioral pattern detection due to higher statistical volatility at that scale.
- Behavioral signatures are predefined patterns that activate when a bank’s data matches a recognizable financial condition. For example, a “Profitability Leader” designation applies to banks with return on assets at or above the 75th percentile within their asset cohort.
Who is the Banking Scorecard for?
The platform was designed for three primary audiences:
- Bank leadership teams, enabling executives and boards to evaluate performance against truly comparable institutions rather than distorted national averages.
- Commercial lenders and treasury teams, enabling faster counterparty evaluation by identifying institutional risk before deals are made.
- FinTech and enterprise sales teams, turning public financial data into operational sales intelligence that identifies high-probability opportunities based on institutional conditions.
FAQ
What data does the BlastPoint Banking Scorecard use?
The platform uses publicly available FDIC call report data sourced through the FDIC BankFind API. Data is refreshed quarterly and includes financial information for every active FDIC-insured institution in the United States.
What metrics does the Banking Scorecard track?
The Scorecard tracks 12 banking performance metrics:
- Return on assets (ROA)
- Total loans
- Net interest margin (NIM)
- Efficiency ratio
- Loan-to-deposit ratio
- Tier 1 capital ratio
- Delinquency rate
- Non-performing asset ratio
- Non-interest-bearing deposit share
- Non-interest income percentage
- Asset size
- Total deposits
What is the efficiency ratio in banking?
The efficiency ratio measures how much operating expense a bank incurs to generate revenue. Lower efficiency ratios generally indicate stronger operational performance because less revenue is consumed by overhead and operating costs.
What’s the difference between national percentile and cohort percentile?
National percentile ranks a bank against the full national universe of FDIC-insured institutions. Cohort percentile ranks it only against institutions in the same asset cohort. Cohort percentile is the more meaningful number for most operational decisions.
Why are banks under $500 million excluded from signature scoring?
Banks below the $500 million asset range carry significant non-conventional risk factors. A single large commercial relationship, one-time charge-off, or local market event can greatly distort performance metrics. At that scale, these distributions become too noisy for the pattern logic to remain reliable. However, these banks still receive full percentile rankings across all 12 metrics.
Does the Scorecard cover credit unions?
BlastPoint’s Banking Scorecard covers FDIC-insured banks exclusively. If you are looking to compare NCUA-insured credit unions, BlastPoint’s CU Scorecard covers a similar cohort-based architecture. It can be found here: https://cuscorecard.blastpoint.com/
Where does your bank stand?
The best thing a bank of any size can do to remain competitive is understand where it stands among its peers and identify how to close efficiency gaps. BlastPoint’s Banking Scorecard is already helping institutions uncover opportunities to better utilize resources and target customers, enabling stronger performance based on their current market position rather than comparisons to the nation’s largest banks.
Are you ready to benchmark your bank against your peers? You can see how every FDIC-insured bank in the country stack up against their peers here: https://bankingscorecard.blastpoint.com/
Last updated May 26, 2026.