Summary: BlastPoint’s new EE Savings Benchmark scores 286 U.S. utilities on their commercial and industrial (C&I) energy efficiency performance – giving utilities, policymakers, and energy firms a new competitive benchmark.
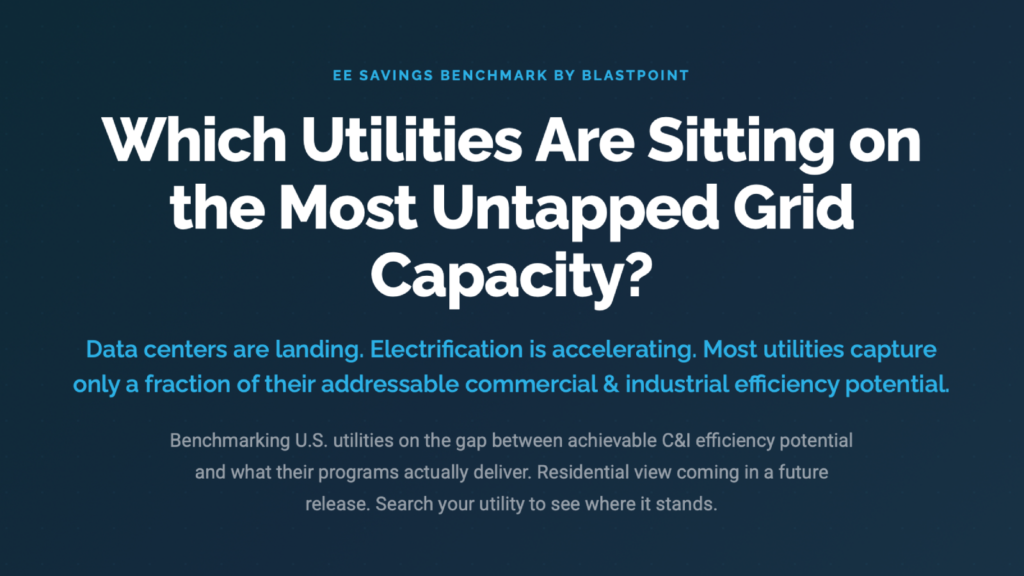
The energy grid is running out of capacity faster than it can be built up. Regardless if it is from data centers, corporate development, or consumer usage, demand for electricity is rising – and the gap between utilities that are delivering on energy efficiency and those that are falling behind has never been more expensive to ignore.
The data driving this gap has been buried for years; hidden in federal filings that few organizations had the capacity to properly analyze and compare. As a result, the top-performing utilities are capturing nearly four times as much of their commercial customers’ achievable savings as a typical large utility, while the lowest-ranked utilities capture almost none.
BlastPoint has worked to close this gap by launching the EE Savings Benchmark – a publicly searchable analytics platform that scores and ranks 286 U.S. electric utilities on their C&I energy efficiency program performance. The EE Savings Benchmark is the first tool of its kind to comprehensively translate raw regulatory data into a clear scorecard that compares the annual electricity savings each utility’s C&I customers could realistically achieve against the opportunities electric utilities are seizing to improve their grid capacity – and to put that intelligence directly in the hands of the people who need it.
What is the BlastPoint EE Savings Benchmark?
The EE Savings Benchmark is a utility benchmarking platform that measures how effectively electric utilities run C&I energy efficiency programs. It was designed to answer at a glance which utilities are actually helping businesses reduce electricity consumption – and which are not.
Built on federal EIA Form 861 data for utilities that report C&I EE program activity to the U.S. Department of Energy, the Benchmark goes well beyond static tables and raw statistics and processes that information into comparative performance scores and behavioral classifications so utilities can understand where they stand against the rest of the market.
It calculates:
- The annual gap between how much energy each utility’s C&I customers could theoretically save and what programs are currently delivering.
- EE cost per kWh saved to show the efficiency of efficiency programs.
- Program ROI relative to avoided energy costs.
- Commercial customer growth and bill trends by service territory.
- Demand response penetration and peak reduction performance.
- Multi-year trends showing improvement or erosion over time.
The result is an intelligent scorecard – not a repository of statistics – wherein each utility receives a performance grade and behavioral signatures to characterize in plain language its quantitative standing within its peer cohort.
Residential EE benchmarking data is currently in development and will be available in a future release.
Why is energy efficiency important for utilities?
Energy efficiency programs remain the cheapest energy resource available to utilities – costing substantially less than new generation, grid expansion, or the social cost from high energy burdens on low-income communities. What is more complicated to understand is which utilities are capturing those benefits at scale and which ones are leaving opportunity at the door.
The EE Benchmark attempts to answer that question systematically for C&I customers for the first time at a national scale. This makes it a meaningful tool for an industry increasingly expected to demonstrate measurable outcomes for businesses and residents rather than simply report program activity.
What makes the EE Savings Benchmark different?
While utility-level EE data has long been publicly available, the process of converting it into actionable intelligence has historically required substantial analytical effort. The EE Savings Benchmark turns this effort into a free public tool that provides several quality-of-life enhancements, including:
- Peer-adjusted benchmarking to contextualize metrics against utilities in similar circumstances.
- Translates reports from kWh to dollar-based metrics – such as estimated cost savings and program ROI.
- Quantifies how much potential electricity reduction exists within each utility’s business customer base, estimated from the highest-consuming business types in each service territory.
- Visualization of trends across a five-year period (from 2020 to 2024).
- Assigns behavioral signatures to allow non-analysts to understand operational narratives.
How does the Benchmark work?
The EE Savings Benchmark is calculated using publicly available data from EIA Form 861, the Bureau of Labor Statistics Quarterly Census of Employment and Wages (QCEW), EIA’s Commercial Buildings Energy Consumption Survey (CBECS 2018), and the U.S. Department of Energy’s Scout tool.
The formulas:
Capture Score = Reported C&I Savings ÷ Achievable Potential
Achievable Potential = Establishments × kWh per Establishment × Achievable-Savings Factor
This compares what a utility’s commercial and industrial program actually delivered against a bottom-up estimate of what its territory’s businesses could realistically save. The denominator is built from the mix of businesses in the service territory (NAICS establishment counts from QCEW), the typical electricity intensity for each sector (CBECS 2018), and the share of that consumption considered achievable through program-realistic efficiency measures (DOE Scout / ACEEE, approximately 50% of technical potential).
Utilities are graded within their cohort using four tiers:
- Leading (Top 20%)
- Progressing (Next 20%)
- Trailing (Next 20%)
- Minimal (Bottom 40%)
Why is the EE Savings Benchmark relevant now?
The launch of the Benchmark comes at a time when pressure on utilities to find and act on measurable energy burdens is rapidly increasing.
Three forces converged to make this the right moment:
- Federal investment has outpaced accountability infrastructure. The Inflation Reduction Act and related federal incentives directed billions of dollars towards demand-side energy programs and electrification incentives. At the same time, state commissions have raised energy efficiency savings targets. However, the infrastructure to hold utilities accountable to those targets hasn’t kept pace.
- Energy burden has become a central policy concern – and commercial demand is a growing part of why. The surge in data center construction, AI infrastructure, and large-scale commercial development is driving electricity demand in utility service territories across the country. When that demand is not offset by commercial energy efficiency programs, the cost flows downstream: residential customers absorb higher rates even when their own usage hasn’t changed. Analyzing how effectively utilities are running C&I efficiency programs is one direct way to understand how well grid demand is being managed before it becomes a billing problem for households.
- AI customer intelligence is changing what is possible. By applying behavioral AI to utility data, utilities can quickly identify which customers are most likely to enroll in an energy efficiency program, fall behind on payments, or respond to a specific outreach channel. Having access to these analytics tools not only makes it easier to get customers on these programs but prevents time from being wasted on low-propensity outreach.
How are utilities ranked in the EE Savings Benchmark?
The Benchmark understands comparing a rural electric cooperative serving a handful of towns to a multi-state, Fortune 500 utility is analytically meaningless. As a result, utilities are ranked across four cohorts:
- National – consisting of 286 utilities that report commercial and industrial EE program data to the U.S. Department of Energy
- Tier – grouped by customer count into Large (100k+), Medium (10k–100k), and Small (<10k)
- State – to compare operations in similar regulatory environments
- Ownership Type – if they are investor-owned, municipal, or cooperative
Within each cohort, the Benchmark calculates percentile rankings on core energy efficiency metrics. A utility can then see its absolute number, where it sits in the distribution, and whether that position has shifted over the past five years.
Utilities are additionally assigned behavioral signatures if they meet certain benchmarks that showcase areas of strength or weakness. For example, an “EE Leader” signals a utility in the top 15% nationally for energy efficiency savings per customer, while a “Commercial Gap” flags an organization where little or no commercial EE savings are being delivered relative to residential programs. This classification system allows users to see at a glance specific patterns rather than needing to interpret a table of percentiles.
Who is the EE Savings Benchmark for?
The Benchmark was built with several distinct audiences in mind, including:
- Utility program managers who can benchmark C&I EE performance against peers and isolate performance gaps by segment, geography, or program type.
- State utility commissions and regulatory staff who gain a faster way to evaluate whether proposed savings targets and DSM plans are genuinely ambitious relative to national performance.
- Energy efficiency administrators who can identify utilities underperforming on the cost-per-kWh metric and prioritize outreach accordingly.
- Investment analysts and energy consultants who can incorporate EE program performance and customer affordability indicators into broader due diligence considerations.
- Advocacy organizations and research institutions who can connect commercial energy demand trends with utility performance outcomes to identify territories where affordability concerns are most pressing.
FAQ
What data does the BlastPoint EE Savings Benchmark use?
The Benchmark is built on EIA Form 861, the annual federal survey of all U.S. electric utilities that covers customer counts, sales, revenue, advanced metering, demand response, energy efficiency programs, and operational data from 2020 through 2024. The Benchmark tracks utilities that report commercial and industrial EE program data to the U.S. Department of Energy.
What kind of utilities are included in the EE Savings Benchmark?
The Benchmark covers 286 U.S. electric utilities that report commercial and industrial EE program activity, including investor-owned utilities, municipal utilities, and rural electric cooperatives.
Is residential energy efficiency data available in the EE Savings Benchmark?
Residential EE benchmarking data is currently in development and will be available in an upcoming release. The current Benchmark scores utilities on their commercial and industrial (C&I) program performance, and the underlying residential data has already been computed and is part of the platform’s infrastructure.
What does “energy burden” mean?
Energy burden refers to the share of household income spent on electricity costs. As large commercial and industrial energy consumers – including data centers – drive up grid demand in utility service territories, the cost impact on residential customers is one of the key dynamics the Benchmark helps illuminate.
Can EE Savings Benchmark data be used in regulatory filings?
The Benchmark draws on the same EIA-861 data that utilities file with the federal government, making it a credible source for benchmarking claims in regulatory proceedings. BlastPoint recommends consulting with regulatory counsel on appropriate citation practices for specific filings.
Where does your utility stand?
What currently separates a strengthening utility from a weakening one is the correct deployment of energy efficiency programs. BlastPoint’s EE Savings Benchmark is already showing organizations where they have opportunities to reduce grid demand and billing strain for themselves and their customers.
Are you ready to benchmark your utility against your peers? You can see how 286 U.S. utilities stack up here: https://eeindex.blastpoint.com/
Last updated May 27, 2026.